How Charts And Graphs Can Improve Business Decision Making
by Arnab Dey Business Development Published on: 05 April 2023 Last Updated on: 06 April 2023

In the fast-paced world of business, making informed decisions is essential for success.
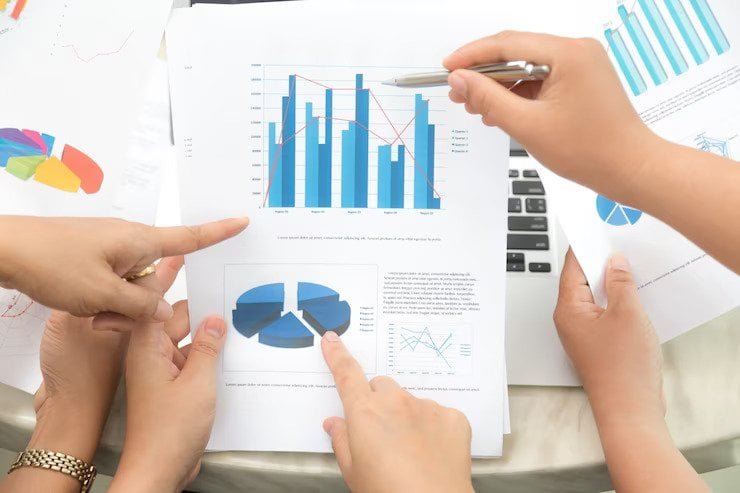
However, with so much data available, it can be challenging to make sense of it all. That’s where charts and graphs come in. Visual representations of data can help business owners and managers quickly analyze and interpret complex information.
Here are some ways that charts and graphs can improve business decision-making:

Identify Trends and Patterns
One of the primary benefits of using charts and graphs in business decision-making is the ability to identify trends and patterns. Visual representations of data can highlight changes in sales, customer behavior, and other key metrics. By identifying these trends and patterns, business owners and managers can make data-driven decisions about everything from inventory management to marketing strategies.
Simplify Complex Data
Another thing charts and graphs can help with is simplifying complex data and making it more accessible. Instead of poring over spreadsheets or lengthy reports, visual representations of data can provide a quick overview of key performance indicators. This simplification can help business owners and managers make faster and more informed decisions.
Make Comparisons
When you make a graph or chart, they can be used to help business owners and managers make comparisons between different sets of data. For example, a bar graph that compares sales for different products or services can quickly highlight which products are performing well and which ones need improvement. By making these comparisons, businesses can focus their efforts and resources on the areas that need the most attention.
Facilitate Communication
Finally, charts and graphs can be used to facilitate communication across different teams within an organization. Visual representations of data can be used to convey information to stakeholders more effectively than lengthy reports or spreadsheets. This can lead to better collaboration, more informed decisions, and improved business outcomes.
What Charts or Graphs Facilitate the Best Business Decision Making?

Charts and graphs are effective tools to help businesses make informed decisions. The right chart or graph can turn raw data into easily digestible information, which can be analyzed to improve business performance.
Here are some of the best charts and cr to enhance business decision-making:
Line Charts
Line charts are an excellent way to track trends over time. They are commonly used to represent changes in sales, customer behavior, and website traffic. With a line chart, businesses can see how their data is trending and adjust their strategies to respond to any changes.
Heat Maps
Heat maps are used to represent data in a two-dimensional format. They are commonly used to represent data such as website traffic, showing the frequency of visits to specific pages. Heat maps can help businesses identify areas of their website that need improvement, such as pages with low engagement or high bounce rates.
Bar Charts
Bar charts are perfect for making comparisons between different sets of data. For example, a bar chart could be used to compare the performance of different products or services. By comparing data in this way, businesses can quickly identify which products are performing well and which need improvement.
Scatter Plots
Scatter plots are used to identify correlations between two variables. For example, a scatter plot could be used to identify a relationship between advertising spend and sales. By using this chart, businesses can determine whether an increase in advertising spend has a direct impact on sales.
Pie Charts
Pie charts are used to show the proportion of data. They are commonly used to represent market share or the percentage of sales attributed to different products or services. Pie charts make it easy to see how much of the total is attributed to each category.
Gantt Charts
Gantt charts are used to visualize project schedules. They provide a clear overview of the tasks involved in a project, their duration, and their dependencies. Gantt charts are useful for identifying potential delays or roadblocks, allowing businesses to adjust their plans accordingly.
In conclusion, using charts and graphs can significantly improve business decision-making. By identifying trends and patterns, making comparisons, simplifying complex data, and supporting data-driven decision-making, visual representations of data can help business owners and managers make faster, more informed decisions.
Whether you are a small business owner or the CEO of a large corporation, incorporating charts and graphs into your decision-making process can help you stay ahead of the competition and achieve long-term success.
Read Also:


